
Hugging Carbon: Quantifying the Training Carbon Emissions of AI Models at Scale
Authors
- INSAIT, Sofia University “St. Kliment Ohridski”, Bulgaria
- University of Sydney, Australia
- The Chinese University of Hong Kong, Shenzhen
- Shenzhen Institute of Artificial Intelligence and Robotics for Society (AIRS)




Summary
🌱 AI’s carbon problem is widely acknowledged but rarely measured at scale. Unlike manufacturing or agriculture, the AI industry still lacks standardized accounting methods that extend beyond individual models. Hugging Carbon uses Hugging Face as a public corpus to estimate aggregate training emissions from energy, compute, and model metadata, even when disclosures are incomplete. It estimates nearly 60,000 metric tons of CO₂e across more than 5,000 popular open-source models.
- Training is one of the most important stages among the AI lifecycle.
- AI energy consumption and emissions are no longer invisible externalities.
- Without quantification, no one knows how large the problem is today, or how large it might be in the near future.

Low Self-Disclosed Rate: Less than ~0.2% of Hugging Face Repos Directly Disclose Training Emissions
Methods
Turn heterogeneous Hugging Face metadata into emission estimates with empirical validation.
Three-Tier Strategies
Repository Counts by Tier (Downloads > 5,000)
| Tier | NLP repos | CV/MM repos | Total repos |
|---|---|---|---|
| Tier 1 | 390 | 352 | 742 |
| Tier 2 | 944 | 1,679 | 2,623 |
| Tier 3 | 3,053 | 220 | 3,273 |
Training Emissions Formula for Tier 1 Models
AI Training Carbon Intensity Definition
Regression Estimation for Tier 2 and Tier 3 Models
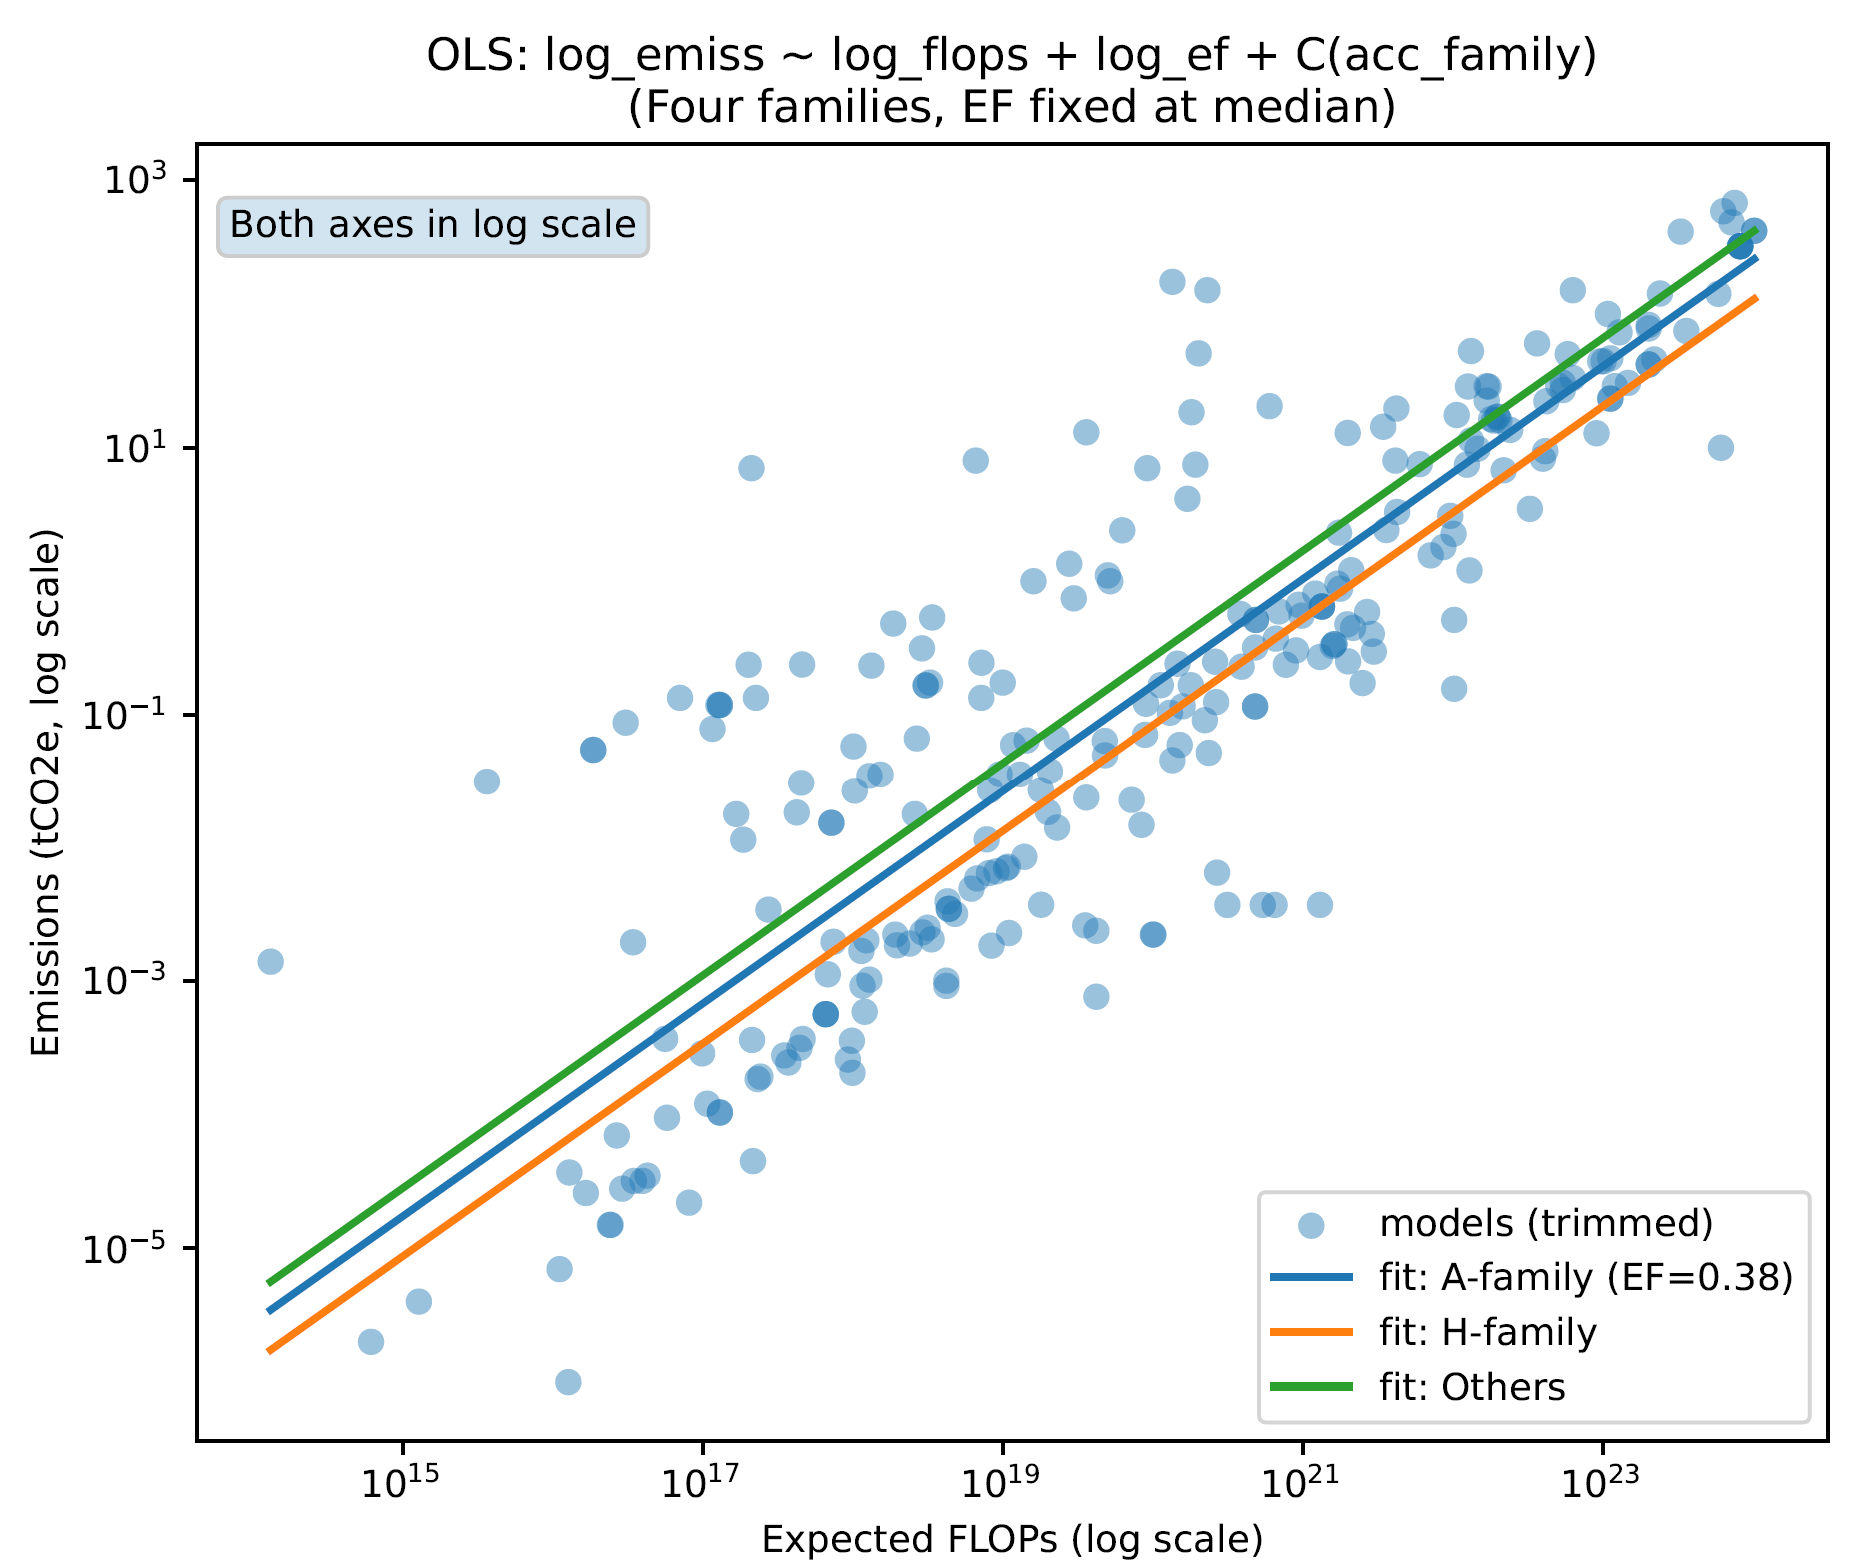
When disclosures are incomplete, we estimate training emissions with log–log regressions fit on Tier 1 models.
+1% training FLOPs
(Tier 2)
A100/A800
(Tier 2)
A100/A800
(Tier 2)
Tier 2 (FLOPs → emissions). Training emissions increase strongly with computational demand: a 1% increase in training FLOPs is associated with ~0.83% higher emissions.
Tier 3 (parameters → emissions). When training FLOPs are missing, we instead regress emissions on parameter count.
Results
Mean ATCI, Mean Per-Model Emissions, and Totals
| Category | Average ATCI (tCO₂e/EFLOP) | Mean (tCO₂e) | Total (10^4 tCO₂e) |
|---|---|---|---|
| Foundation & Individual Models | 0.14 | 12 | 5.6 |
| Finetuned Models | 0.23 | 8 | 0.4 |
| CV & Multi-Modal (MM) Models | 0.16 | 12 | 2.3 |
| NLP Models | 0.13 | 11 | 3.6 |
- Modality matters: Vision/multimodal models have higher ATCI.
- Lifecycle matters: Finetuned models tend to have higher ATCI.
- Hardware matters: H100/H800 reduces emissions by ~56% vs. A100/A800.
Estimated Annual Training Emissions of AI Models in Hugging Face
Downloads > 5,000- Rapid growth: Annual training emissions increased by nearly 100× within five years.
- NLP surged: NLP became the largest contributor during 2022–2024.
- CV/MM rebounded: Vision and multimodal models regained the lead in 2024–2025.
Citation
@inproceedings{wang2026huggingcarbon,
  title     = {Hugging Carbon: Quantifying the Training Carbon Emissions of AI Models at Scale},
  author    = {Wang, Xinlei and Ming, Ruibo and Qiu, Jing and Zhao, Junhua and Gu, Jinjin},
  booktitle = {Proceedings of the Forty-Third International Conference on Machine Learning},
  year      = {2026}
}